
See Where Production Performance
Is Being Lost
Track OEE across lines, batches, and operations to understand performance, quality, downtime, and production losses.
OEE Visibility
Lines, batches & operations.
Loss Analysis
Downtime & production losses.
Performance Insights
Quality, output & performance.
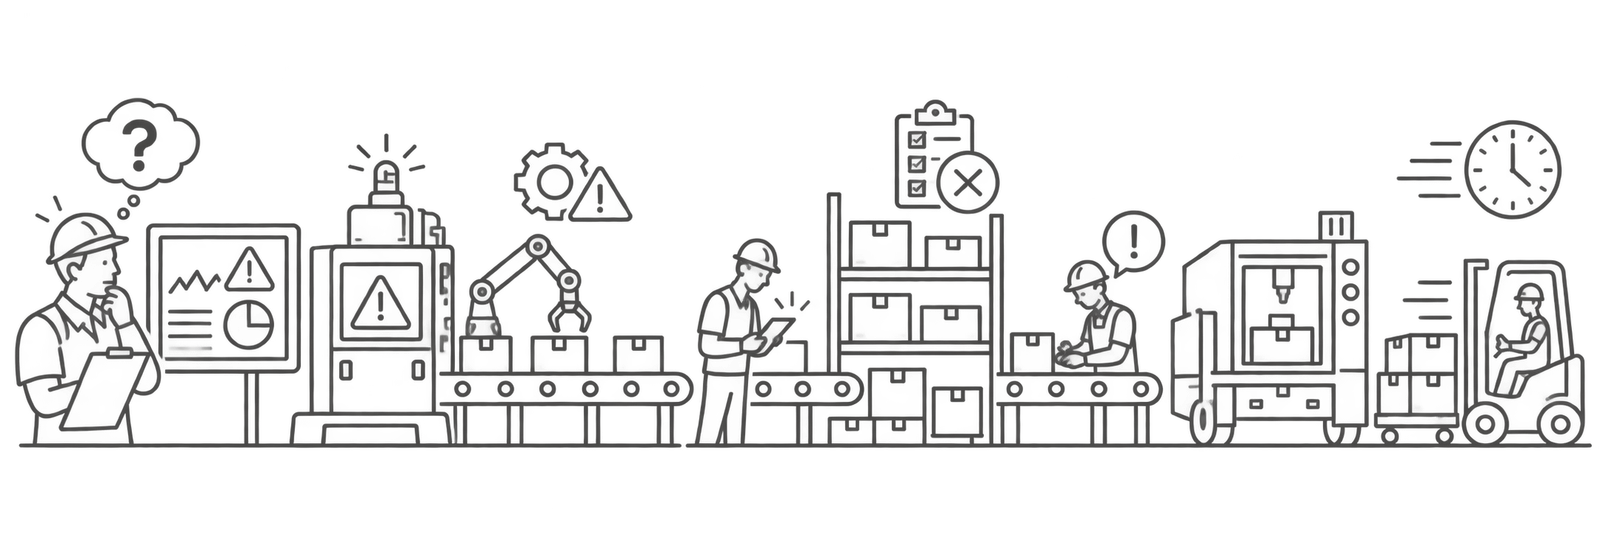
Is Your Production Team Facing These Challenges?
Knowing the OEE number is not enough. Your team needs to understand what caused the loss.



Turn OEE Data Into Production Insights
IOT3SIXTY connects production, batch, operation, downtime, quality, and material data into one reporting flow. From One Number to the Complete Picture
A single percentage hides everything that matters
Most production teams can tell you their OEE number. Very few can tell you which shift, which machine, or which batch is pulling it down - and by exactly how much.
The gap between knowing OEE and improving it comes down to data depth. A spreadsheet-calculated OEE tells you what happened. IoT3Sixty tells you why.
Downtime gets logged late or not at all
Manual entry delays mean your daily OEE report is already historical by the time anyone reads it.
Batch and operation data stay disconnected
Line-level OEE can look fine while individual operations run well below target - with no one aware.
Quality loss is invisible until shift end
Rejection tracking happens in batches, not in real time - so speed and quality losses compound undetected.
Calculate your OEE in minutes
Enter your production data to calculate Availability, Performance, Quality and your overall OEE score.
Everything You Need to Understand OEE
Batch & Line OEE
View OEE, production, quality, yield, and downtime across batches and production lines
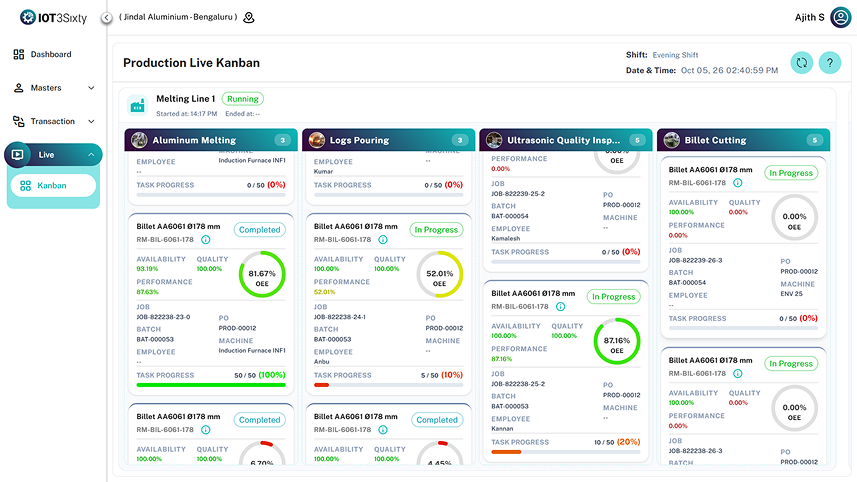
Operation-Wise Performance
Identify which production operation is affecting overall performance such as Melting → Pouring → Inspection → Cutting
Downtime & Quality Analysis
Analyze downtime reasons, production losses, rejection, scrap, rework, and quality results
Production & Material Insights
Compare production quantities, OEE trends, and planned versus actual material consumption
Performance Scorecards
Compare production quantities, OEE trends, and planned versus actual material consumption
From Production Activity to OEE Insights
Start Production
Set up shifts, lines, machines, batches, and production orders.
Execute Operations
Capture production timing, quantities, cycle time, and quality results.
Record Production
Track planned, produced, accepted, and rejected quantities.
Record Downtime
Capture downtime duration, machine, operation, and loss reason.
Calculate OEE
Combine Availability, Performance, Quality, Yield, and OEE.
Drill Down
Line → Batch → Operation → Downtime → Quality → Materials.
Review Performance
Use reports and analytics to identify areas requiring attention.
Start Production
Set up shifts, lines, machines, batches, and production orders.
Execute Operations
Capture production timing, quantities, cycle time, and quality results.
Record Production
Track planned, produced, accepted, and rejected quantities.
Record Downtime
Capture downtime duration, machine, operation, and loss reason.
Review Performance
Use reports and analytics to identify areas requiring attention.
Drill Down
Line → Batch → Operation → Downtime → Quality → Materials.
Calculate OEE
Combine Availability, Performance, Quality, Yield, and OEE.
What Changes on the Shop Floor?
Better Visibility
See production performance across lines and batches
Faster Analysis
Identify downtime and production losses faster.
Higher Productivity
Identify underperforming batches and operations.
Better Traceability
Follow performance from line to batch to operation.
Smarter Decisions
Use production data to support improvement discussions.
Built for Data-Driven Manufacturing Leadership

INDUSTRIES
DEPARTMENTS
USERS
Questions Production Teams Ask

Stop Asking “What Was Our OEE?”
See the complete picture behind your production performance. Track the Line. Understand Every Batch. Find the Losses.